3D Print Your Favourite Geography
by Tay Powrie
“I am currently a MSc student in the Environmental Science program at Thompson Rivers University. My area of research is focused on watershed management – currently I am working on a collaborative project with Adams Lake First Nations and the Shuswap Watershed Council to quantify glacier melt inputs into the Adams watershed. This research will help managers develop a cumulative effects model to further understand hydrological impacts of glacier recession within the watershed.”
If you are new to 3D printing and all the software that is used within this write up, there is a video attached at the end that is meant to help you through all the steps. I would recommend reading this post first and then watch the video. With the write up and video, you should be able to 3D print your own landscape model in no time!
Who can do this and what is required?
Anyone with access to a computer and the TRU Makerspace! The TRU Makerspace has the Ultimaker Cura software and 3D printers necessary. All other software and files needed are open access and easily accessible as described below.
The staff at the Makerspace is super friendly and willing to help. The best part is, it’s all free. You just need to complete the introductory 3D printing exercise as directed on their website. All information for this exercise can be found here:
Note, this is an explanation of how to 3D print a geography with arbitrary (i.e. non-rectangular) shapes, such as a watershed. If you are okay with square or rectangular boundaries, it is very simple! Just visit either of these websites:
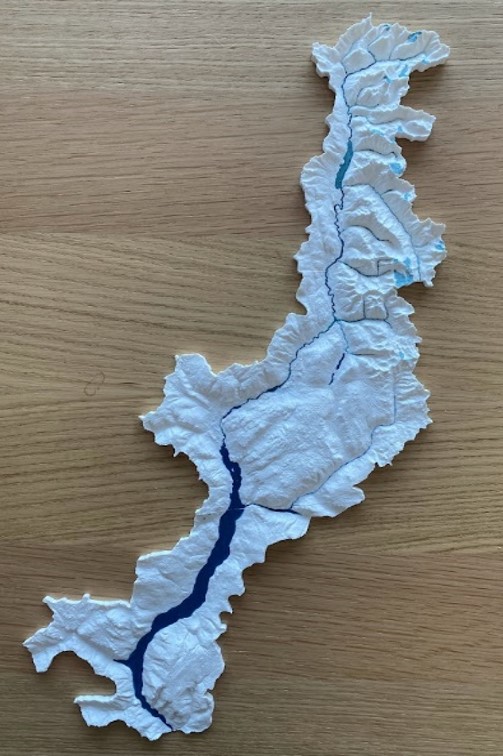
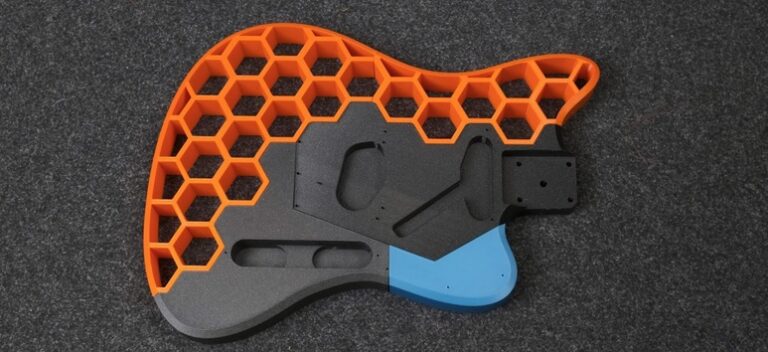
Figure 1. 3D print of the Adams watershed in interior British Columbia
What is a geography?
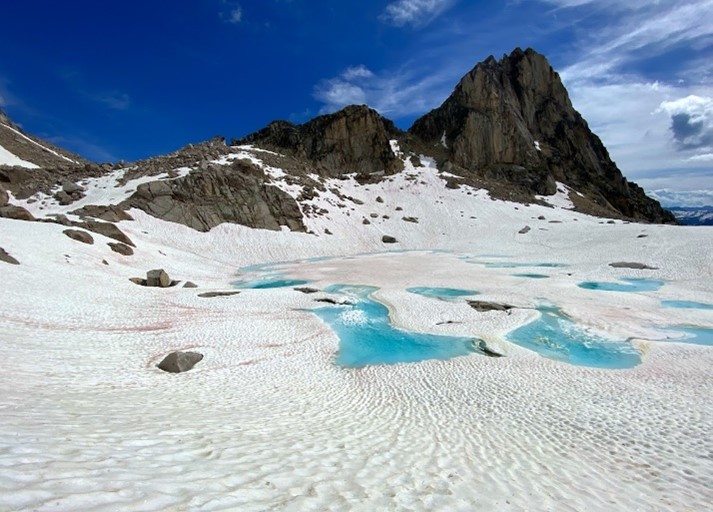
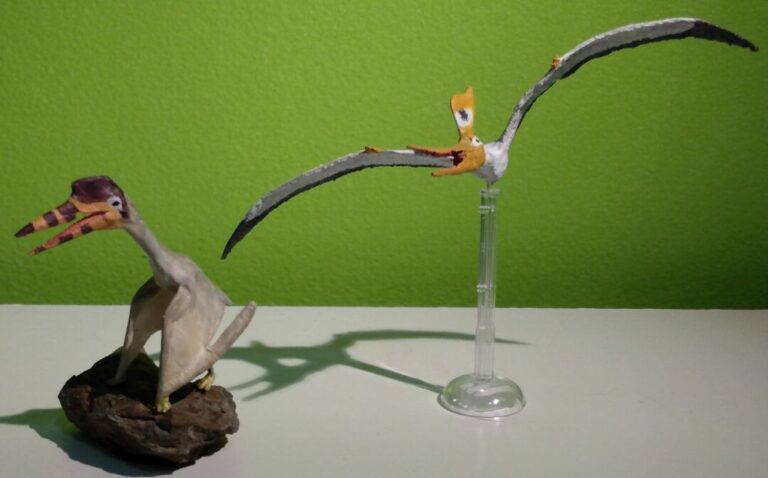
Figure 2. An example of a geography – Eastpost Spire rising out of the Bugaboo Glacier in southeastern BC.
A “geography” is a physical landscape or terrain feature of a particular area or region, encompassing the mountains, valleys, rivers, and other natural features, that define a geographic location. For example, you could 3D print the glacier and rock outcrop in Figure 2, or you could 3D print an entire watershed, as the video directions show.
So how can we 3D print a geography?
We can model a geography using a Digital Elevation Model (DEM) that represents the surface elevation of a specific landscape for each point on a spatial grid – visualize a large mesh blanket draped over a landscape with each square of the mesh having an associated X, Y, and Z value, or latitude, longitude, and elevation value. A DEM for a specific area can be converted into a STL file quite easily, which can then be 3D printed!
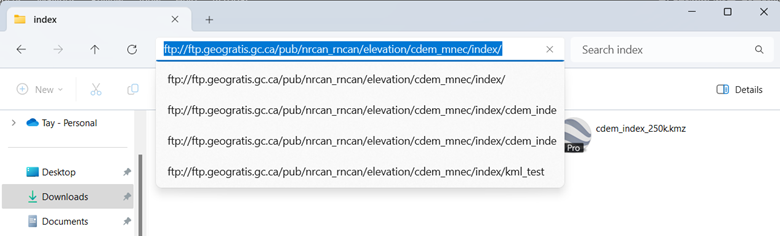
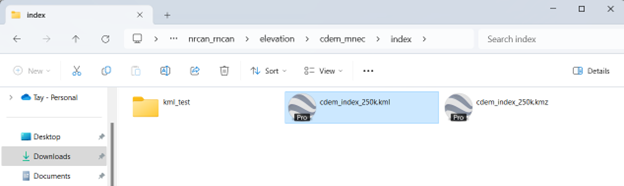
Keep in mind that the resolution importance of the DEM (i.e., how many ‘pixels’ or squares in the mesh that are used to model the area) will be relative to the area extent. In other words, if you are modelling a large area, you may need to reduce the resolution of the DEM to reduce the file size; whereas, if you are modelling a small area, you will need to ensure you have sufficient resolution to show all the intricacies of the geography. For most cases, DEM’s from the Canadian Digital Elevation Data are sufficient for any area within Canada. These can be accessed by pasting this link into an ftp browser such as ‘file explorer’: ftp://ftp.geogratis.gc.ca/pub/nrcan_rncan/elevation/cdem_mnec/index/
Click and drag the ‘cdem_index_250k.kml’ file into your downloads folder.
Once this file is in your downloads folder, if Google Earth is installed on your computer, it should open in Google Earth just by clicking on the file. If Google Earth Pro is not yet installed on your computer, you can easily download it here: Download Google Earth Pro
This will show you all the available DEM tiles that cover Canada. Click on the tile(s) that encompass your geography, which opens a window that shows a TIFF file highlighted in blue. Clicking the TIFF file will download it. This is demonstrated in Figure 4.
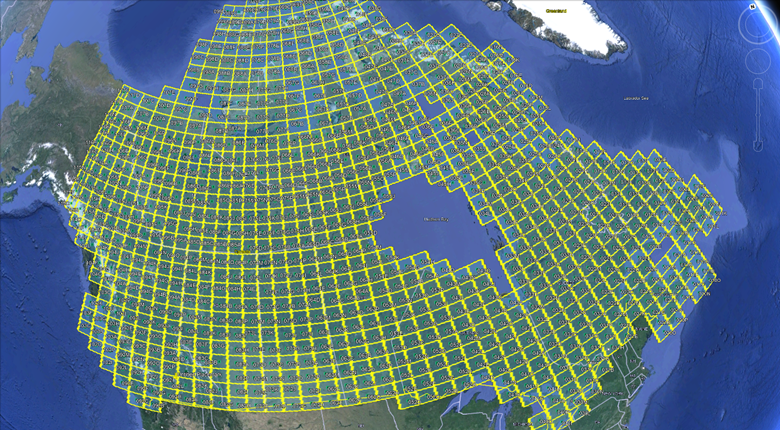
Figure 3. A snapshot of Google Earth with all the DEM tiles available for download within Canada.
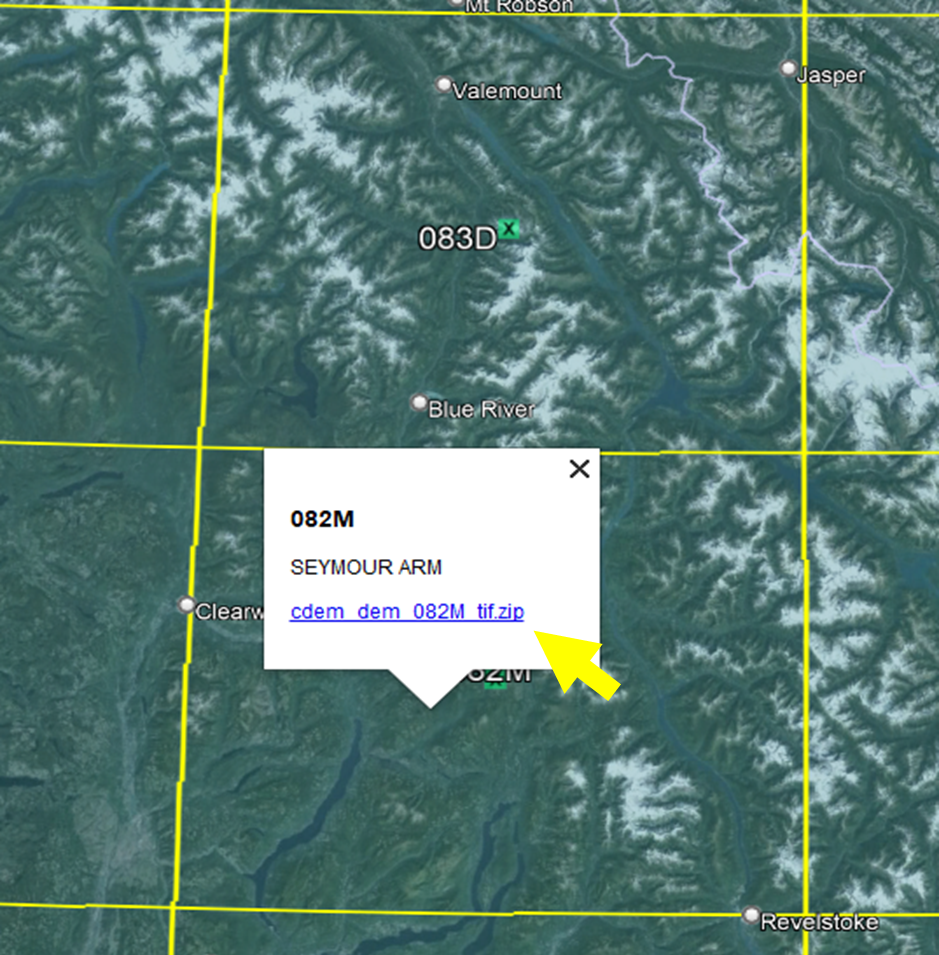
Figure 4. This figure shows the window that pops up when a DEM tile is selected in Google Earth. To download the TIFF file, click the zipped folder highlighted in blue.
We will download the 083D, 082M, and 082L tiles for this exercise. The downloaded DEM tiles will be in your ‘Downloads’ folder in a zipped format. The TIFF file can be extracted by right clicking and selecting ‘Extract all…’ and then ‘Extract’. Each extracted folder will contain the desired TIFF file (e.g., ‘cdem_dem_082M.tif’).
Now that we have the desired TIFF files, we need to load them into QGIS by dragging them into the main QGIS window (QGIS download). In this write up, the basic steps will be outlined, but if you are inexperienced with QGIS, the linked video will really help with the QGIS steps – go to the 10 minute time stamp.
If you have more than one DEM tile that encompasses your geography, you will first want to use the ‘merge’ function on all your tiles in QGIS. Once they are merged, you can use the ‘clip by mask layer’ function to clip the merged tile by a polygon of your geography. This polygon can be drawn manually in QGIS or downloaded from a resource such as the BC data catalogue.
Once your DEM tiles are merged and clipped, you are ready to export your new DEM layer as an STL file. To do this, you will need to install the DEMtoSTL plugin in QGIS. The plugin is found in the ‘Raster’ drop down menu after it has been installed. You can now input the required values (as explained in the video) and export your DEM to an STL!
The video explaining all the steps, as well as what each variable within the DEMtoSTL pane means can be accessed here.
NOTE: To make sure that you can drop the rectangle base of the geography below the 3D printer platform, as mentioned in the video, you need to make sure the ‘Height (m):’ variable is lower than the ‘Lowest point:’ that is stated beside the input cell as highlight in Figure 5.
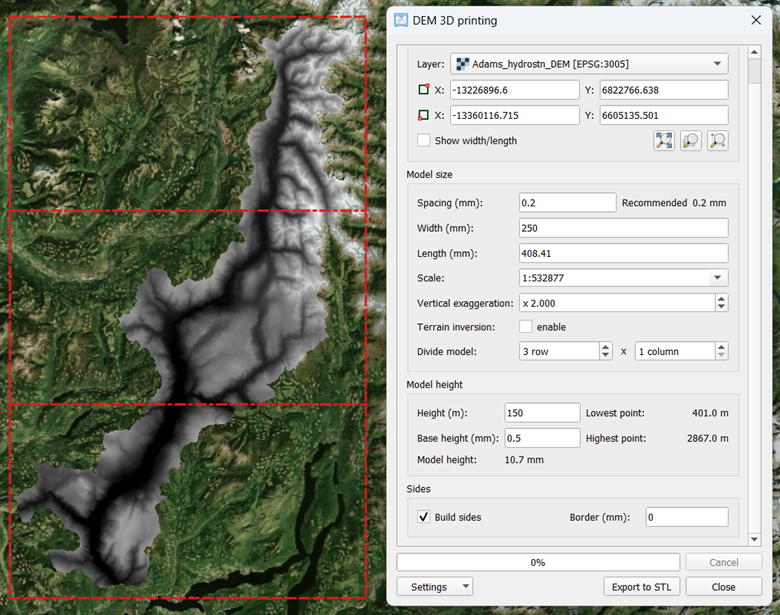
Figure 5. Left: a merged and clipped DEM ready to be exported as an STL. The read dashed lines show the bounding box around the DEM and show that it will print in three separate sections as selected. Right: the pane to change output variable. The highlighted box is the most important when you are printing a DEM with an arbitrary (i.e., non-rectangle) boundary.
To show what it means by dropping the square base of your model within the Ultimaker Cura software, Figure 6 shows what your model will look like when uploading your STL file into the program, and Figure 7 shows what it should look like once you have lowered you model so the base is below the 3D printer platform. Everything that is black/grey will not be printed and everything that is yellow will be printed.
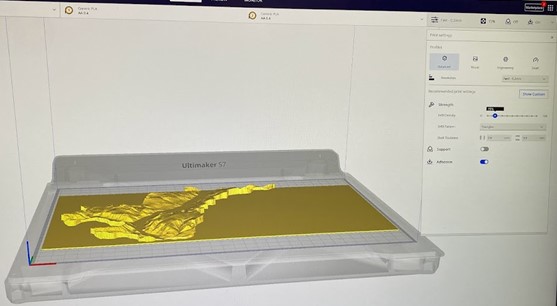
Figure 6. This is what the lower section of the Adams watershed model looked like when uploaded to the Ultimaker Cura software.
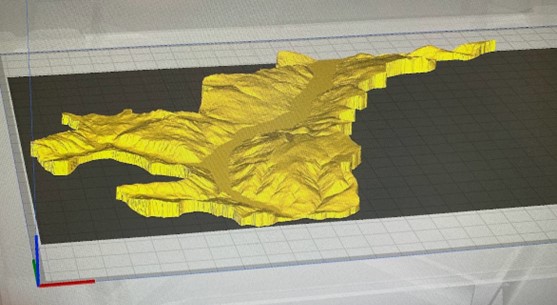
Figure 7. This is what the lower section of the Adams watershed model looks like in the Ultimaker Cura software after it has been lowered so only your geography is above the 3D printer platform. Only the area highlighted in yellow will be printed.
Have fun with this! If you have any questions you can send an email to tpowrie@tru.ca.